Interpreting the output:
The genome shown on the right panel (mouse in panel A) is the source genome and the genome on the left (human) is the target genome. All the chromosomes of the source genome are shown in unique colors. Each chromosome of the target genome is shown as composed of segments of some chromosome of the source genome, as indicated by the corresponding color. For example, the majority of human chromosome 1 is composed of (i.e. is syntenic to) mouse chromosome 4, 3 and 1.
Note: Bacterial genomes are circular but they are modelled as linear for ease of analysis. We plan to allow circular representation in the future.
Things to try:
- To compare two chromosomes in detail, select one chromosome from each genome from the list displayed right below the synteny map and click on "Go to Chr v/s Chr View" button
- Click on any synteny block on the left side to view the block in detail
Examples:
Whole genome comparison for human vs. mouse genomes, panels A and B;
and for drosophila vs. nematode, panels C and D. Syntenic blocks obtained
without any coarse-graining (NOAGG) are shown in panels A and C.
On the other hand, an intermediate aggregation (INTAGG), with the minimum
length of synteny blocks set to 100 kb, is used to show only sufficiently
long blocks in panels B and D.
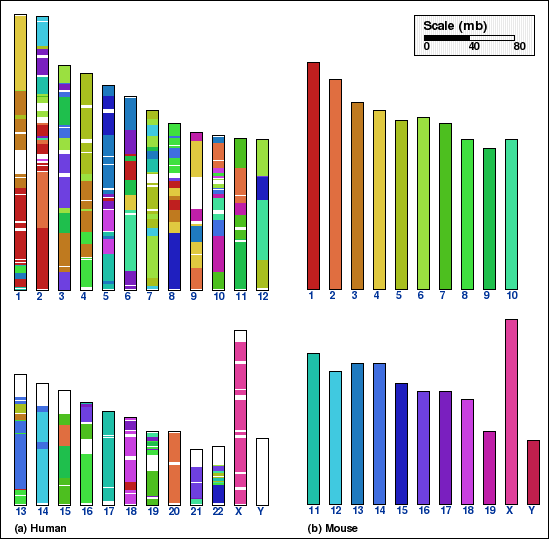
Panel A: Whole genome comparison of human and mouse genomes using NOAGG. Number of synteny blocks is 828 and RD is 348.

Panel B: Whole genome comparison of human and mouse genomes using INTAGG. Number of synteny blocks is 626 and RD is 314.
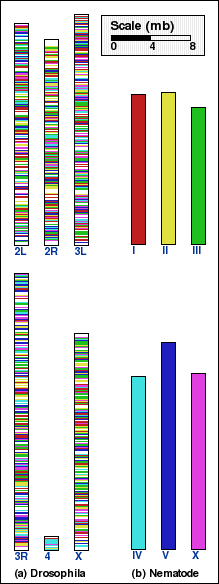 Panel C: Whole genome comparison of drosophila and nematode genomes using NOAGG. Number of synteny blocks is 3145 and RD is 3150. |
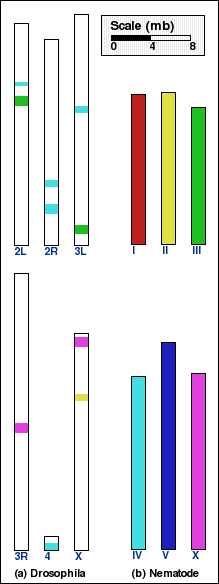 Panel D: Whole genome comparison of drosophila and nematode genomes using INTAGG. Number of synteny blocks is 8 and RD is 12. |