Interpreting the output: Common markers located on the chromosomes of interest are used in this analysis. Each synteny block on a chromosome is shown in an unique color. The corresponding synteny block on the other chromosome is shown in the same color and connected by lines to indicate the change in (or preservation of) order.
Things to try:
- Click on a synteny block on either chromosome to view it in detail
Examples:
This example shows analysis of synteny for X chromosomes in selected mammalian genomes. Human and dog X chromosomes are compared in panels A and C and mouse and rat X chromosomes are compared in panels B and D. Panels A and B are generated without aggregation. In the second set of figures, Panels C and D, default aggregation (DEFAGG) is used.
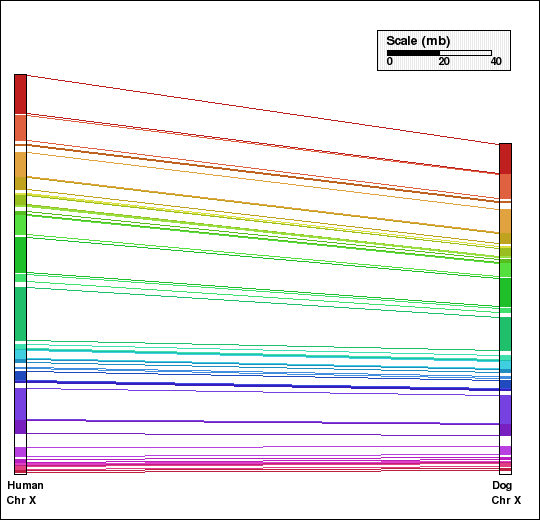
Panel A: Comparison of X chr of human and dog genomes using NOAGG. Number of synteny blocks is 29 and RD is 0.
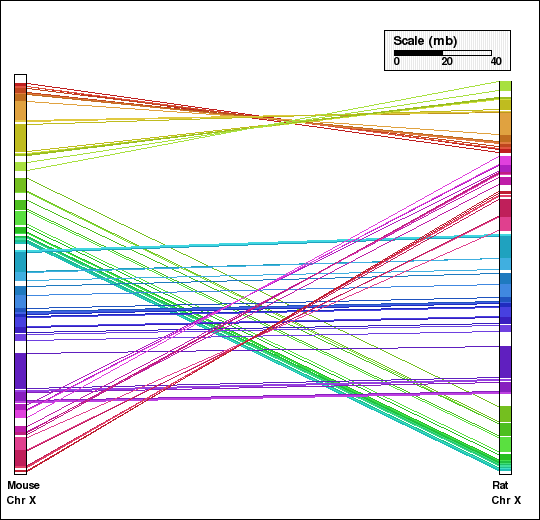
Panel B: Comparison of X chr of mouse and rat genomes using NOAGG. Number of synteny blocks is 49 and RD is 14.
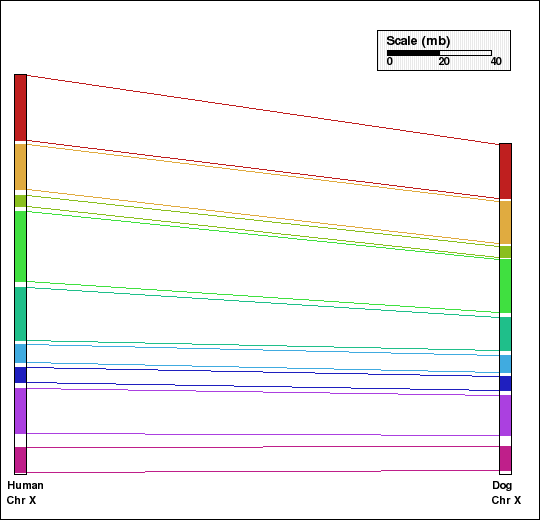
Panel C: Comparison of X chr of human and dog genomes using DEFAGG. Number of synteny blocks is 9 and RD is 0.
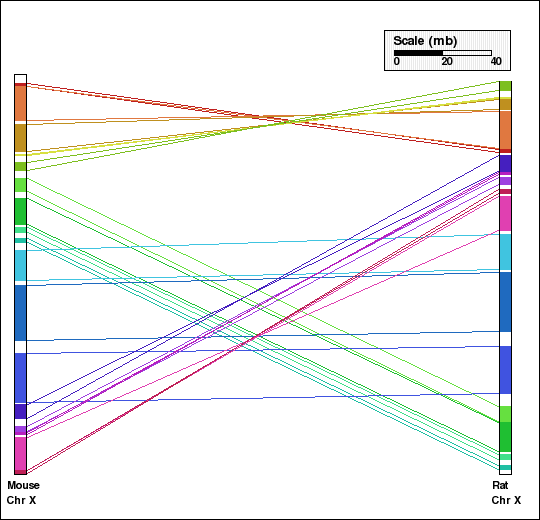
Panel D: Comparison of X chr of mouse and rat genomes using DEFAGG. Number of synteny blocks is 17 and RD is 8.