Number of Synteny Blocks
The following figures show the variation in number of synteny blocks in human-mouse genomes due to the parameters min_len and max_gap. Results are shown for 3 different data sets; HomoloGene (orthologs), RoundUp (ortholog), GRIMM-Synteny (sequence tags).
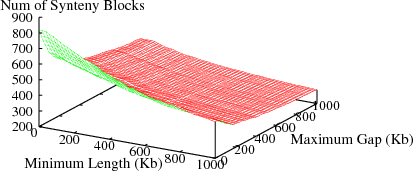
Figure S1(a): HomoloGene data
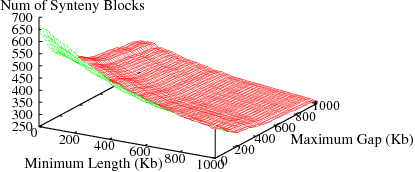
Figure S1(b): RoundUp data
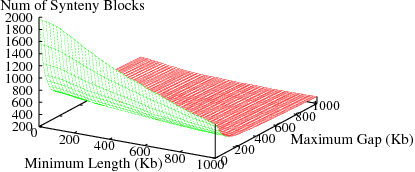
Figure S1(c): GRIMM-Synteny data
The following figures show the variation in number of synteny blocks in human-mouse genomes due to the parameters min_len and max_gap. Results are shown for 3 different genome pairs using the HomoloGene (orthologs) data set.
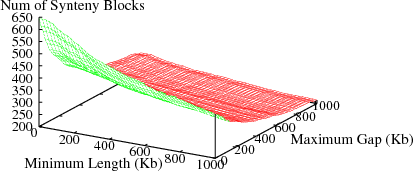
Figure S2(a): Human and Dog genomes
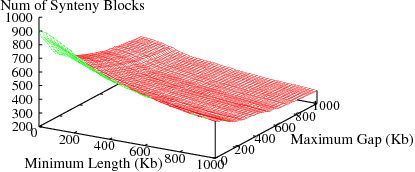
Figure S2(b): Human and Rat genomes
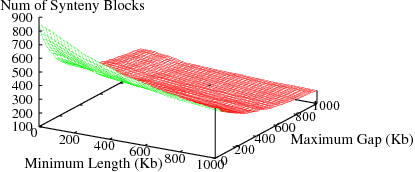
Figure S2(c): Mouse and Rat genomes
Reversal Distance
The following figures show the variation in reversal distances in human-mouse genomes due to the parameters min_len and max_gap. Results are shown for 3 different data sets; HomoloGene (orthologs), RoundUp (ortholog), GRIMM-Synteny (sequence tags).
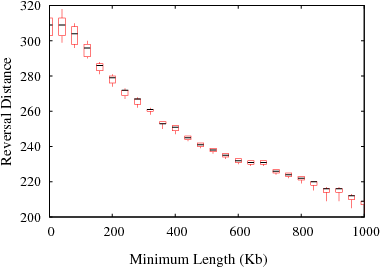
Figure S3(a): HomoloGene data
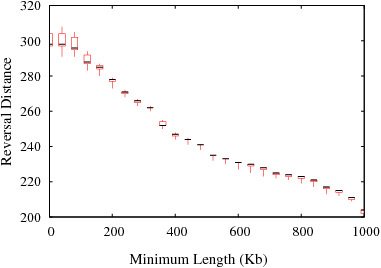
Figure S3(b): RoundUp data
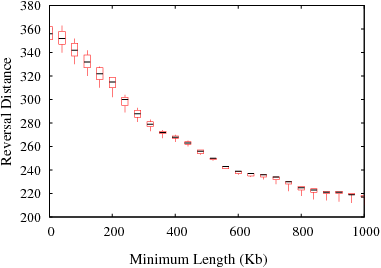
Figure S3(c): GRIMM-Synteny data
Multiple Genomes
The following figure shows the change in reversal distance in human and mouse genomes due to min_len using 2-way and 5-way approaches. The former was done using the genes common to human and mouse and the latter was done using the genes common to human, mouse, dog, rat, chimp genomes. The number of orthologs for the 2-way and 5-way analysis was 16,330 and 10,574, respectively. To assess if the decrease in RD in 5-way approach is simply due to fewer number of genes, we also plotted the variation in RD with a random set of 10,574 genes using a 2-way approach.
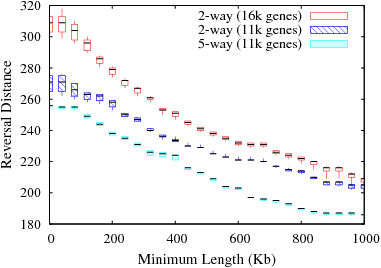
Variation in reversal distance for 2-way and 5-way analysis